Function(Other Function)
![]()
![]()
![]()
![]()
![]()
![]()
![]()
![]()
Function(Other Function)
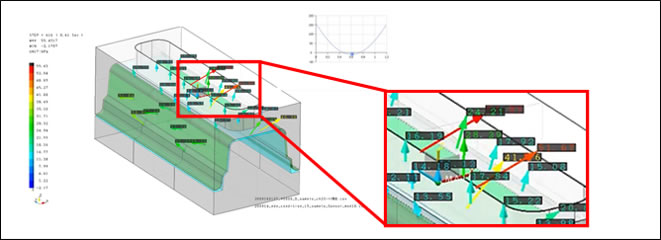
It is now possible to superimpose pressure and other sensor information about mold and press dies onto CAD data. By visualizing information about molds, the system supports the entire lifecycle of molds, from the design process to maintenance.
The actual situation at the molding site is measured using IoT technology, and the sensor data for one shot is visualized in 3D space with colored arrows.
For example, by displaying color and temperature changes as arrows on the 3D CAD data according to the "direction" and "value" of the stress, the overall trend can be grasped to optimize the design.
If you have any inquiries about our product or would like to request a visit to your place for explanation or demonstration, please use the inquiry form.
![]() Inquiry form
Inquiry form

 Official site